Smoking gun: leaked New Zealand pay-per-dose data shows 21% excess mortality
Statistically significant 0.09% daily rise in excess deaths among covid-vaccinated Kiwis in 2022, driven by boosters [STOP BOOSTING] —— Good news: excess deaths flattened in 2023
“Alright, we put it away. We keep it hidden. We never speak of it again. No one knows it's here, do they? Do they, Gandalf?”
Update, 3 Feb 2024 — A simpler model using contemporary data as the control - which includes unvaccinated New Zealanders - has given a similar result.
Update, 8 Feb 2024 — Same simpler model applied to dose analysis.
Update, 15 Feb 2024 — Unvaccinated data released and integrated into model.
Background
In late November 2023, Barry Young - the top database admin for New Zealand’s national ‘pay-per-dose’ covid vaccine logging system - leaked 4.2m rows of data covering 2.2m individuals (~43% of the Kiwi population). For this act of publicizing information which he described upon release as a “river of tears”, he faces 7 years.
The PPD data’s anonymization and public release was facilitated by Liz Gunn, Steve Kirsch and other humanitarians who work to stop the global covid injection program and assist the many it has injured.
Young was arrested, arraigned and released in the days after Gunn helped him blow the whistle (1h). He currently awaits trial.

Abstract and Purpose
That the covid vaccines are sometimes fatal to humans has long been acknowledged by governments around the world, including by Te Whatu Ora (Health New Zealand). Causal death is established in the peer-reviewed literature (see section 2.4 Diagnosis). Here we test whether the covid vaccines are fatal in large numbers - as confidentially acknowledged by Pfizer to the FDA and other regulators in February 2021 (see table 1 on page 7).
The leaked New Zealand pay-per-dose data is record-level — that is, it tracks individuals by age, dose(s) they received by date(s), and a date of death if the person died before cutoff in October 2023. The PPD data should therefore reveal the ground truth on just how deadly the covid injections are in New Zealand, and around the world by extension.
New Zealand publishes population-level statistics down to 1-year-of-age increments, as well as seasonal mortality rates by month. By applying these granular metrics for years 2016-20 to the precise demographics and seasonality of the PPD data, we build a high-resolution time-series model to determine whether actual deaths have increased significantly in New Zealand versus the pre-vaccine baseline. Furthermore, we run tests and diagnostics on the model’s predictions to check for statistical significance and reliability. Data and code linked within.
High Level Findings
The difference between expected mortality and deaths recorded in the leaked pay-per-dose data - the ‘excess’ - is around 21%. That is, ~21% more deaths among vaccinated/boosted people than would be expected to occur in an unvaccinated population of the same size and age.
Predictive accuracy may be shown by model’s population-wide expected mortality closely aligning (100.58%) with the public tally for 2022.
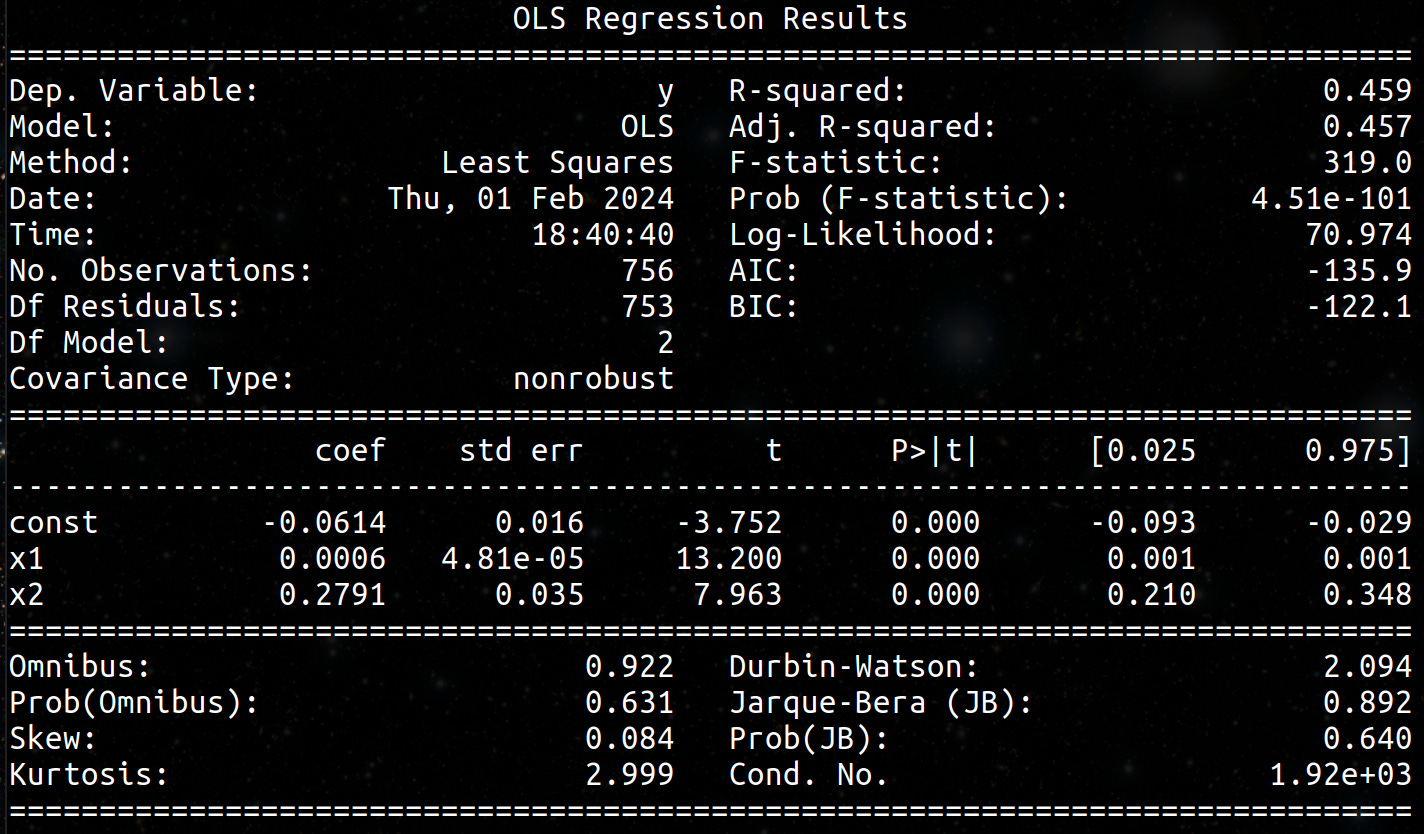
Regression analyses (Ordinary Least Squares and Generalized Estimating Equation) show that the model produces a statistically significant series of ratios against real world data.
OLS with lagged term first-order autocorrelation: R-squared 0.459, F-stat 319, p = 4.51e-101, Durbin-Watson 2.094, Jarque-Bera 0.892
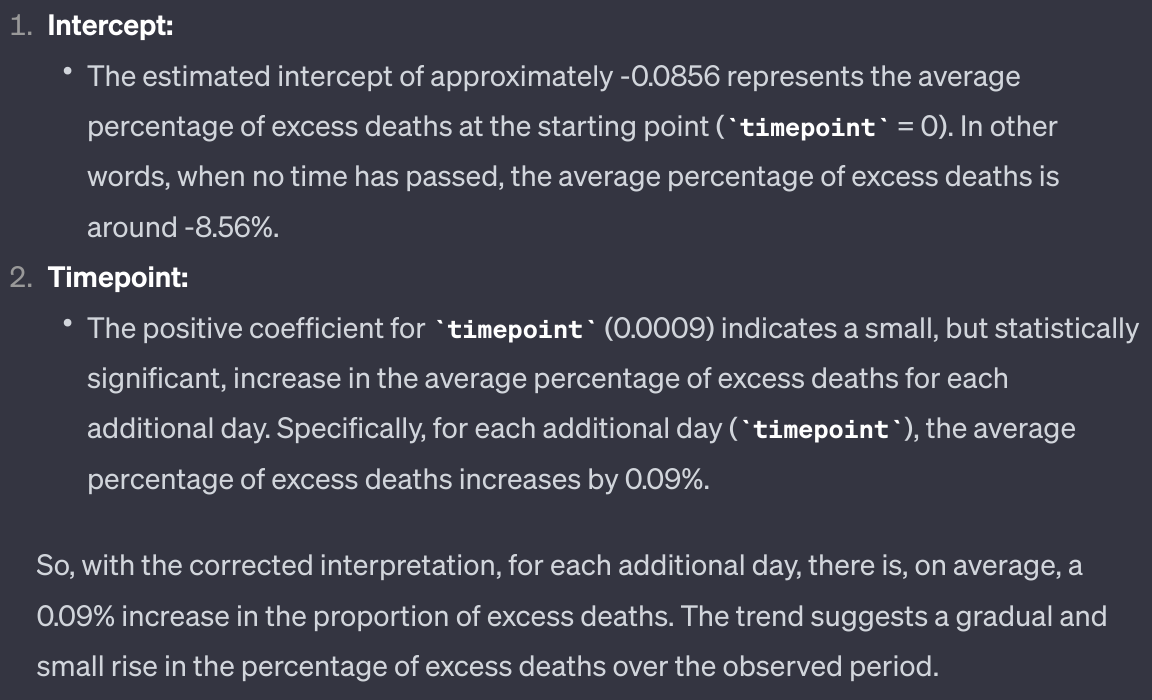
GEE: daily covariate 0.0009, p = <0.001, meaning a statistically significant daily rise in excess deaths by 0.09%
The formerly privileged National Health Index total death count for 2022 (39,504, source: Steve Kirsch) exceeds Stats New Zealand’s total (38,577) by 927 persons — a 2.4% discrepancy. NHI data access is only available to medical providers in N.Z. The discrepancy is likely due to the public stat tracking the deaths of residents only (visitor deaths excluded).
The public figure became a global headline on 19 February 2023; New Zealand Herald, “New Zealand has recorded the largest increase in the number of registered deaths since the 1918 influenza pandemic, new data from Stats NZ shows.”
Model
Green line = model’s projected mortality curve as deaths per day
Orange line = actual recorded deaths per day in the leaked pay-per-dose data
Black line = actual deaths minus projected deaths (excess mortality)
The model is driven by 2016-20 relative mortality rates on a per-year-of-age and seasonally adjusted basis.
Methods
Various python scripts deploying the pandas library were utilized to extract day-wise metrics from the raw PPD data. Those extractions inform a google doc multi-tab spreadsheet which executes the model and renders the charts.
Daily projections are constructed in three steps.
1. Control population generation
To the daily cumulative PPD cohort size, add the number of people that would be expected to die in the same cohort size with the same age distribution as the PPD data, under average 2016-20 conditions.
Command at column C:
=SUMPRODUCT($AH$2:$AH$97, TRANSPOSE($AJ2:$EA2))*G2*1.001

----------------------------
Daily:

(weighted sum of each dose by age [from years 0 to 95+], where sums are derived by relative risk of death per year of age per 1000 people)

X

(number of individuals who are logged for first time that day / number of doses administered that day)

X

(1.001 multiplier [+0.1%] to ensure that [control pop. - PPD pop.] exceeds the total mortality average for 2016-20 by ~10%, see 'Metrics' tab in sheet)
2. Seasonal mortality rate calculation
Adjust the monthly seasonal mortality rates in New Zealand to account for the mean age of the PPD cohort on that day (+1 year to account for average ageing of cohort).
Command at column Y:
=IF(AND(ROUND(B2, 0)>=40, ROUND(B2, 0)<75), (INDEX(AH$100:AH$135, MATCH(ROUND(B2, 0), {40,41,42,43,44,45,46,47,48,49,50,51,52,53,54,55,56,57,58,59,60,61,62,63,64,65,66,67,68,69,70,71,72,73,74,75}))-1)/(365*1000), "OutofRange")

----------------------------
15-day centered moving average of:

((average age of cumulative PPD cohort +1 year, as of that day)

X

((the annual number of deaths in a group of 1000 persons that age relative to a group of 1000 persons of N.Z. mean age [40 years]) - 1))

/ (365 days * 1000 persons)

+

(pre-vax [2016-20 average] daily mortality rate for corresponding month JAN-DEC)
3. Combination
Multiply the age-adjusted control population by the age-adjusted seasonal mortality rates to get the daily projected death estimate under ‘normal’ conditions.
Command at column O:
=E2*Z2

----------------------------
Daily:

(cumulative control population from step 1)

X

(seasonal mortality rate from step 2)

=

the projected total daily dead under normal conditions with a population of same age as those in the PPD data
Then divide the model’s projected daily death counts into real daily counts from the PPD data, and the following curve is produced:
Statistics
The daily-run equation visualized in the chart directly above,
(real deaths / projected deaths) - 1gives us a series of proportions where excess is any number above 0. We feed the series into regression models for analysis. Results indicate that the model does show a statistically significant linear relationship between time and projected excess death.
Ordinary Least Squares with lagged term — CODE
Generalized Estimating Equation (GEE) w/ daily covariate — “idiot proof” — CODE
Discussion
Analysis of the leaked pay-per-dose data using New Zealand’s official national statistics reveals unprecedented excess death: above 20% for covid-vaccinated and especially boosted people as compared to the pre-vaccine period of 2016-20. Statistical significance of the model is strongly indicated by multiple regression analyses. The model is age- and seasonally-adjusted, and its rates seem to be corroborated by close alignment (100.58%) with Stats NZ’s public total mortality count for 2022.
Though vaccine efficacy is outside the direct scope of this model, it is imperative to raise here the infamous negative efficacy finding of Cleveland Clinic researchers, published 19 April 2023 in Oxford University Press,
The risk of COVID-19 also increased with time since the most recent prior COVID-19 episode and with the number of vaccine doses previously received.
Given the vaccines’ unprecedented mortality and negative efficacy (i.e., dose-dependent increased risk of contracting SARS-CoV2), it is incumbent upon the New Zealand government - and every government worldwide - to:
Immediately halt the availability of any covid injection to any human or other being under existing drug recall laws.
Prominently acknowledge and properly assist the scores of injured survivors.

Thank you
Barry Young and Liz Gunn, for releasing the PPD data
ChatGPT 3.5, for assistance with python and excel code
Steve Kirsch, for sourcing the N.Z. NHI total death count of 39,504 for 2022
Canceled Mouse, for initial challenges
mongol_fi, for consistent technical critiques
David Hood, for pointing out that NZ Stats has 1-year granularity and that the public mortality stat covers residents only (not visitors)
Kiwi epidemiologist, for assistance with OLS and GEE
Resources
Raw PPD data
Model spreadsheet and charts (mult-tab google sheet), direct downloads below
NZ Stats Infoshare
National Health Index (NHI)
Update, 3 Feb 2024 — A simpler model using contemporary data as the control - which includes unvaccinated New Zealanders - has given a similar result.
Update, 8 Feb 2024 — Same simpler model applied to dose analysis.
Update, 15 Feb 2024 — Unvaccinated data released and integrated into model.


Try to redo your excess mortality calculation based on my buckets.gz file so that you don't adjust for seasonality but you simply calculate the expected number of deaths based on the number of person-days for each age. If you do the calculation right then your results will be completely different from your v5 spreadsheet. And it will be so much different that the difference can't be explained by the lack of adjustment for seasonality. So then either calculation has to be wrong.
The only thing you have to do is to calculate a sum of person-days for each age: `curl -Ls sars2.net/f/buckets.gz|gzip -dc>buckets;sed 1d buckets|awk '{age=$4;if(age>95)age=95;a[age]+=$5}END{for(i in a)print i,a[i]}'`.
Then take the yearly mortality rates for each age in the second sheet of your spreadsheet, divide them by 365, and calculate the sum of each mortality rate multiplied by the number of person-days for the age.
It gives you a baseline of 37896 deaths. But there's a total of 37315 deaths in the pay-per-dose data, so you get about -1.5% excess mortality.
You're still calculating the baseline wrong, because the baseline shouldn't be that low in 2023. Your results are not consistent with the results of me, canceledmouse, or Uncle John Returns: https://openvaet.substack.com/p/yet-another-dive-in-the-new-zealand, https://twitter.com/UncleJo46902375/status/1732496623123517742, https://twitter.com/UncleJo46902375/status/1741423429641711929, https://twitter.com/UncleJo46902375/status/1751277431929909653.
If the PPD data includes almost half of the NZ population, how can people in the PPD data have 27% excess mortality in 2023 when the total NZ population had close to 0% excess mortality in 2023? Most deaths are in elderly age groups and the vast majority of elderly people are vaccinated, and actually the PPD data includes about 75-80% of the total NZ population in ages 75 and above. So in the scenario that the people in the PPD data are representative of vaccinated people and the average excess mortality among all vaccinated people would be 27%, then unvaccinated people would need to have below -100% excess mortality, which is not possible.
It's also a hack-ass fix that you're adding 1 year to all ages to account for the aging of the cohort. If you accounted for aging correctly then the baseline would be higher in 2023 and lower in 2021. You could do your analysis based on this file instead, which shows the number of person-days and deaths for each age and date so that the ages of people are recalculated on each day: sars2.net/f/buckets.gz. I generated the file with this R script, which is similar to buckets.py except it calculates the ages of people correctly: sars2.net/moar.html#Reimplementing_buckets_py_in_R. (In buckets.py the age of each person is the age at death for people who died, or the age on the day when the script was ran for people who didn't die.)